Data Access Logs
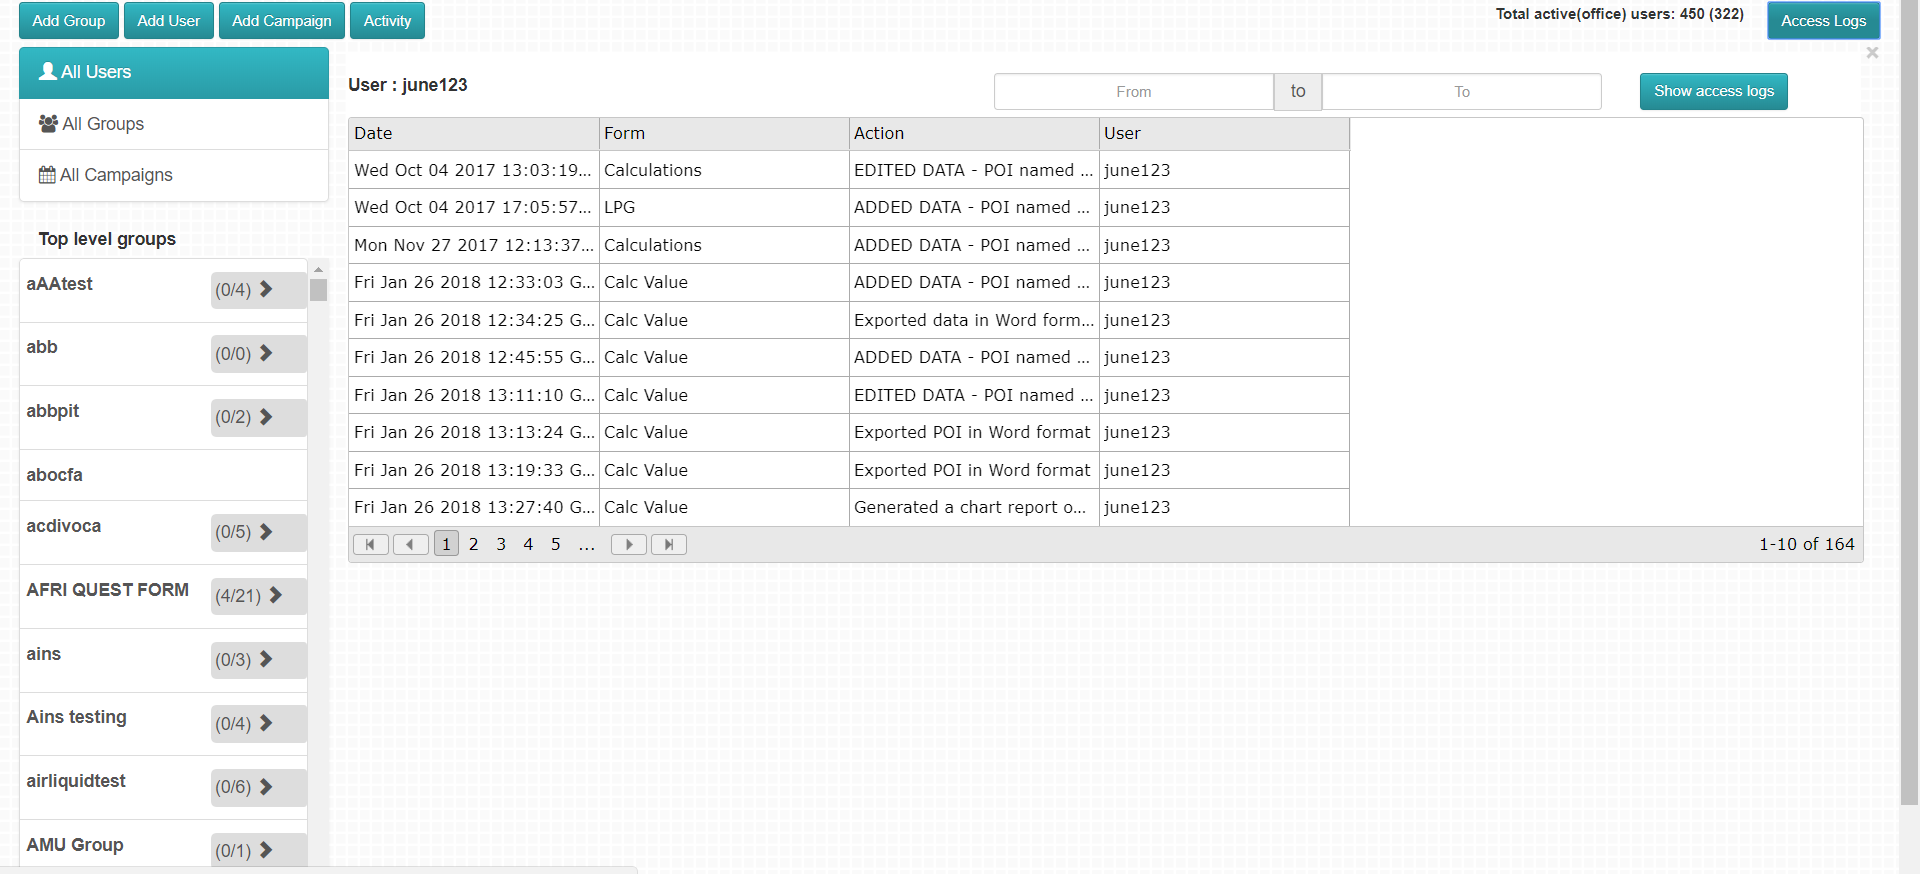
The Data Access Log shows the history of data access either by viewing, editing, generating reports or exporting the data over a specified period of time and by specific users. It also shows the history of changing user names and permissions. To view the data access logs, select a group or a user first then click on the ‘Access Logs’ button on the top right of the page. See figure 17 below.

Figure 17: Data Access Logs Window
It is also possible to filter access logs by the use of dates. For instance if you only want to view logs from 12th June to 18th June, you just enter the dates on and click show access logs button just besides the dates entered.
Activity
Activity feature is used to show number of activities a user or group took in the Poimapper app.
The activity button is displayed next to the Add Campaign button. Before clicking on the activity button, you have to choose a group or user first.
Clicking on the Activity button shows a drop down with options Per Week, Per Month, Per Year.
Besides the drop down option, there are also two check boxes option:
Include Subform Count- when this option is checked then the activity count shown for the users will also include subforms that the users interacted with.
Count each unit data point saved- Checking on this option adds count for each and every unit data point saved.
After checking on the necessary options, you can then click on the submit button and the counts of activities taken up by a user or users on a certain group will be displayed as shown in figure 18 below, Although, when it comes to the groups activity, users that have zero count of activities will not be displayed on the activity table.

Figure 18: Activity
It is also possible to filter and sort each and every column of the activity table as explained on the sort and Filter section