Data Viewer main page
After logging into the Data Viewer, the forms and locations associated with the logged in user will be displayed as shown in figure 2 below:
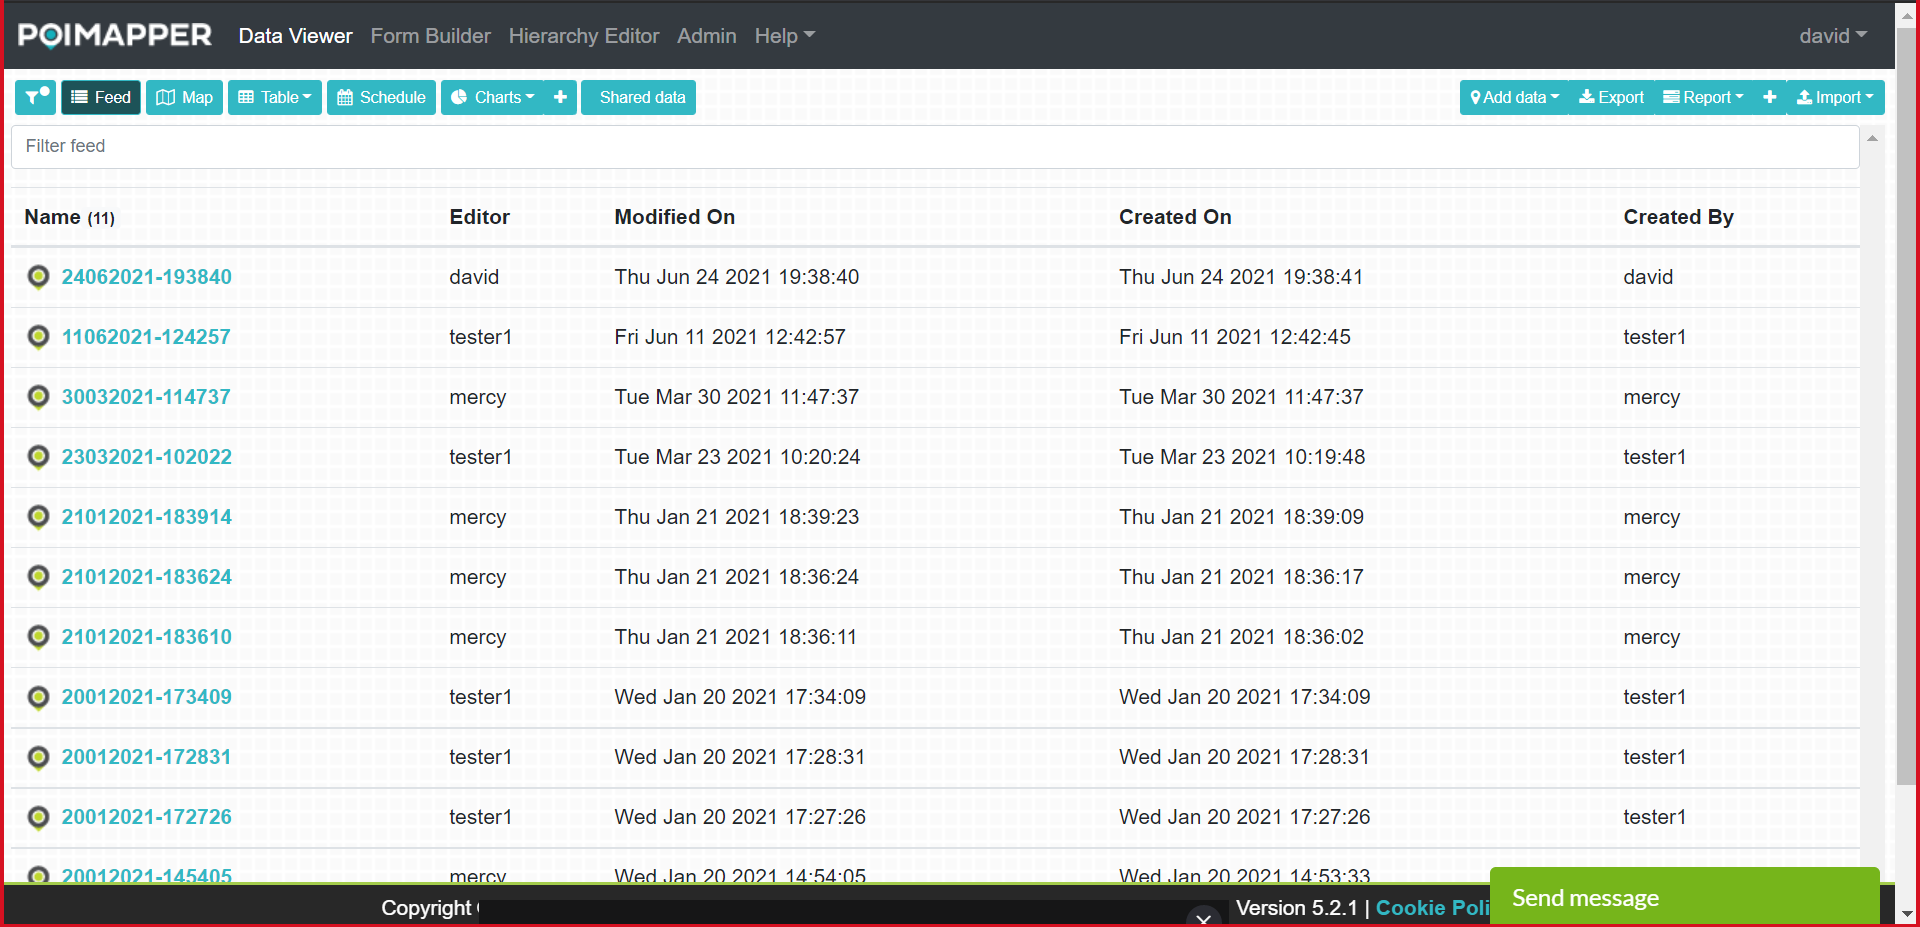
Figure 2: Data Viewer Window
Feed View
The default display is Feed view, which is a list of all data points with rows sorted by last modified date. The filter field can be used to filter data points based on the name of the data point.
The Feed view has five columns:
Name - These are the names of the data points. The number in parantheses shows the number of data points in the feed.
Editor - The user who have most recenlty edited the data.
Modified On - The date when the data point was most recently modified.
Created On - The date when the data point was created
Created By - The user who created the data point.
It is possible to view and edit a data point by clicking on it from the Feed View and the specific data point will open up in the Data Point View (More on this later in the in the manual).
Map View
Just next to the Feed Button on the right, there is a map button, if you click on it, the following page as shown in figure 3 appears. The map view is not shown if no form used by the user has GPS coordinates enabled.
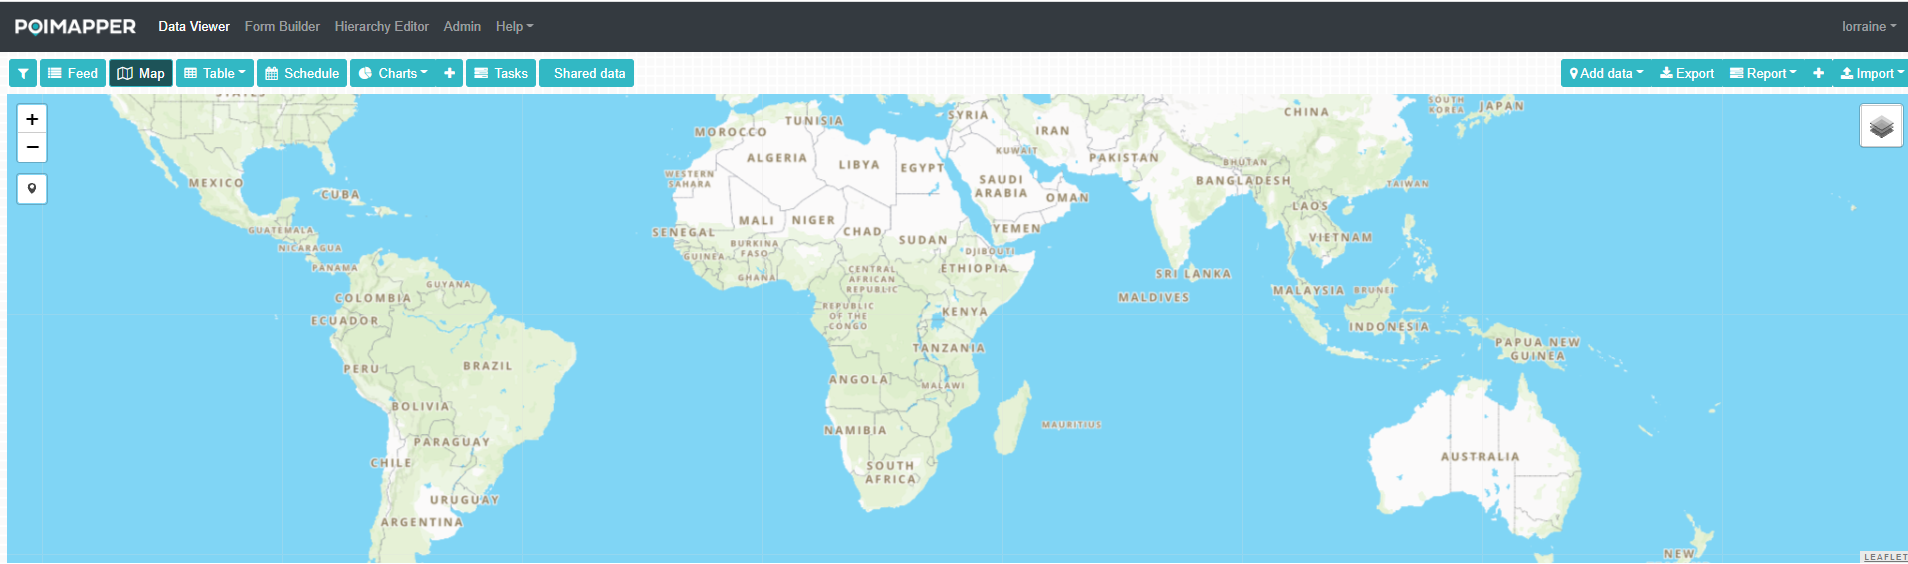
Figure 3: Map View
By clicking the map icon in the upper righ corner of the map custom layers with coordinates can be selected and rendered if those have been imported to the user group.
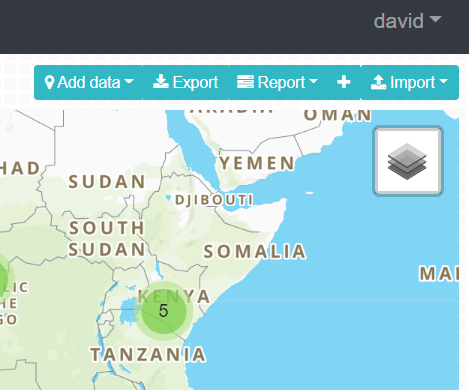
Figure 4: Default Map
Table View
Table view is a feature that gives users the ability to view all the form instances belonging to a selected form and the responses for each associated questions of the form instances (datapoint).
Accessing Table View
Step 1: On the Data viewer, Click on the filter icon, and select a form on the Select form filter. Step 2: Click on the Table button, and click to access the table view feature. Step 3: Click on the filter icon to close the filters.
If you follow these steps, table view will display the selected form and associated data points.
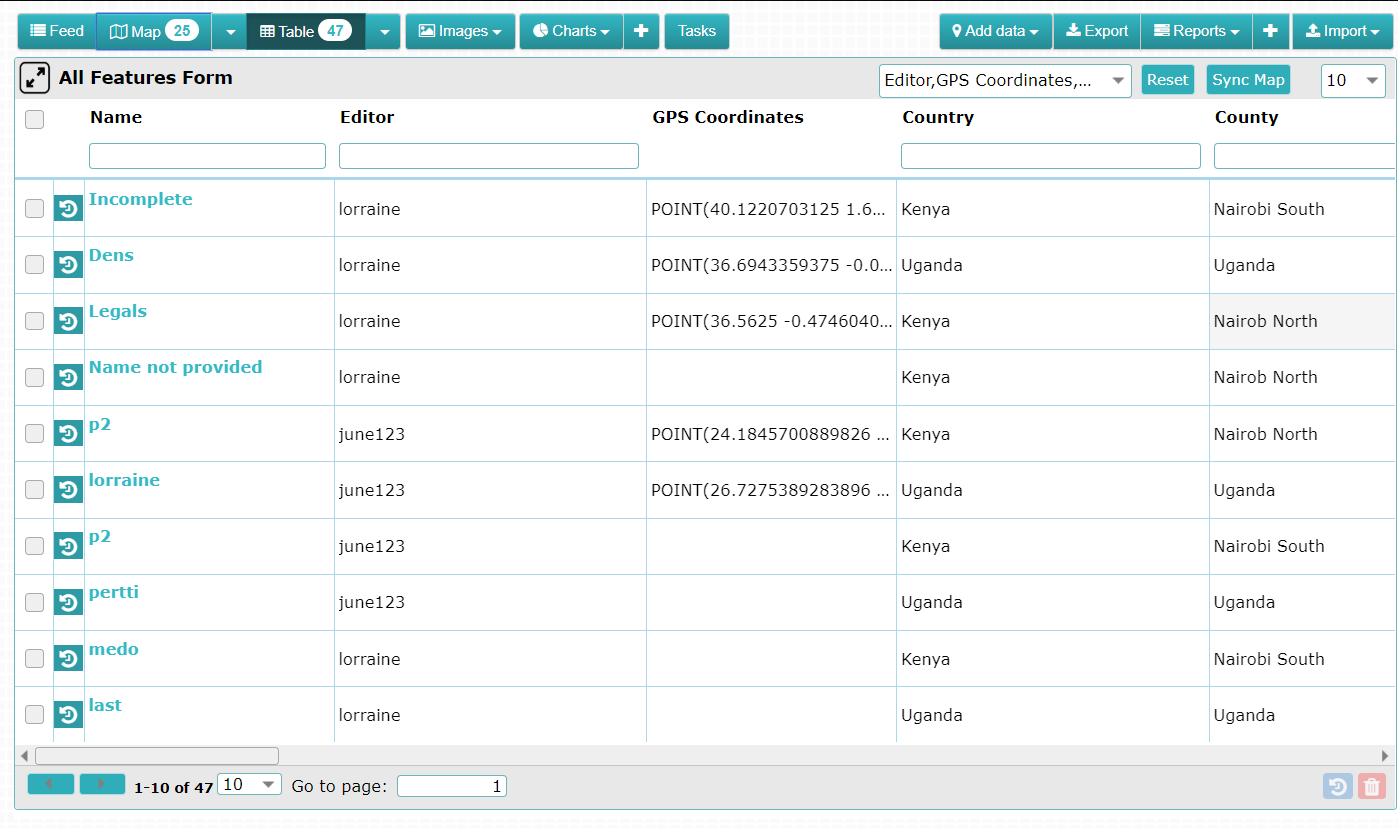
Figure 5: Table View
Table View features:
Once a form is selected, the title of the form will be displayed at the top of the table view.
1. Show/hide columns
Click on the Show/hide column icon to select which fields you want to be hide on table view.
2. Excel Export
Click on the Excel icon button to export a report which contains all the form instances together with all subform and table data.
3. Datapoint History
To view the history of change for a particular data point. Click on the checkbox on the second column that matches with the desired datapoint on the Name column. This feature allows the user to view the previous versions of a data point and a record of when it was modified.
4. Delete button
To view the history of change for a particular data point. Click on the checkbox on the second column that matches with the datapoint on the Name column. This feature allows the user to delete a data point.
5. Tables
The tables column gives the user the ability to view data for all the constituent tables found within the selected data point.
Accessing Data
To access collected data on the map, follow these instructions:
Select a form on the forms list by clicking on the check box next to the form name. You can select more than one form on the list.
After selecting the form, if the user group has locations defined the font of the locations containing collected data on the location hierarchy list will automatically become bold and other locations remain in normal font. This is a visual means on notifying the user that data is under the bold font locations a location on the Location Hierarchy by clicking on the check box next to the location name.
Data based on the selected filtering conditions loads and is displayed on the map as shown in the figure 5 below.
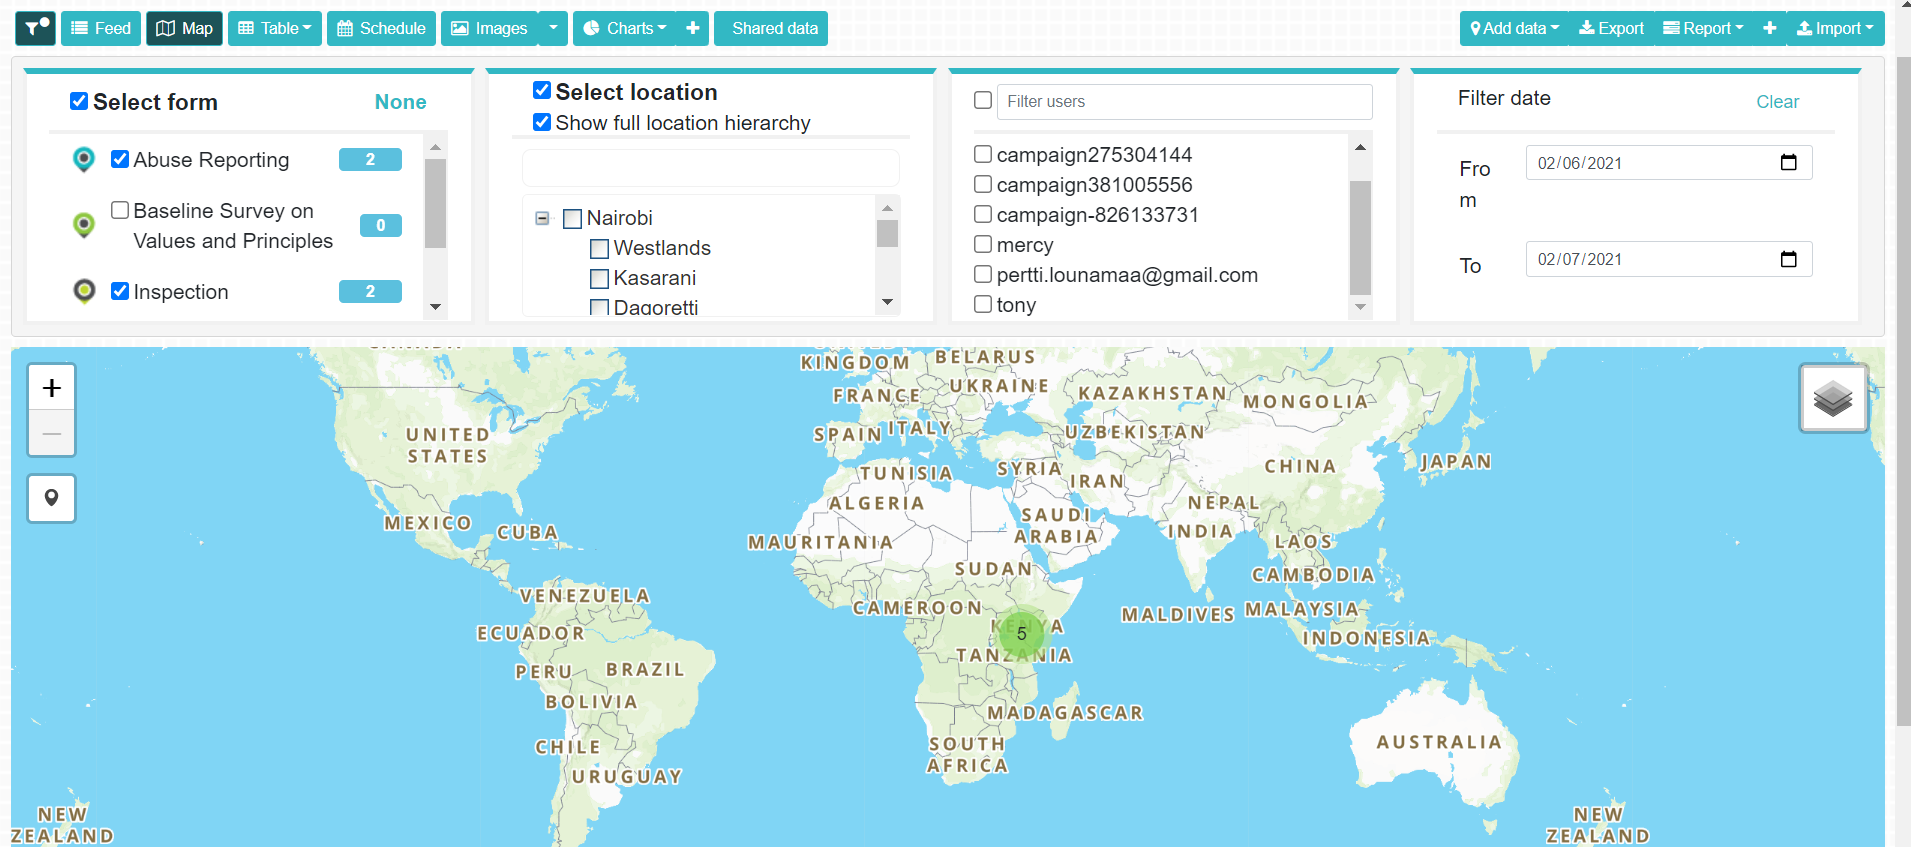
Figure 6: Select Forms and Locations
The icons on the map show the exact locations of where data for the selected form was collected. If there are several data points overlapping on the map a cluster shows the number of datapoints in the cluster.
The number in brackets next to the form name shows the total number of data points collected for the selected forms.
To view the data plotted on the map, click on a marker on the map. A pop up will appear containing the data collected for that data point. Click on the search icon to open the detailed view of the data point. To delete data point instance click on the ‘Delete’ icon.
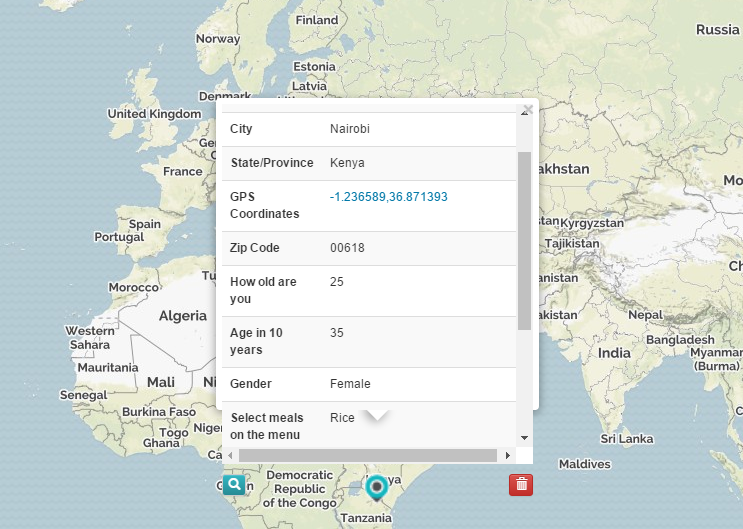
Figure 7: View Data Point on Map
To view the data points in a tabular format, after selecting a form click on ‘Table’ on the menu. Thereafter a table containing the selected data points will be displayed. A list of forms selected from the ‘Select form’ filter will be displayed enabling you to select the form you would like to view. The data points will be organized chronologically with the latest data point as the last one. The tabular format allows you to filter and sort your data as shown in the figure below.
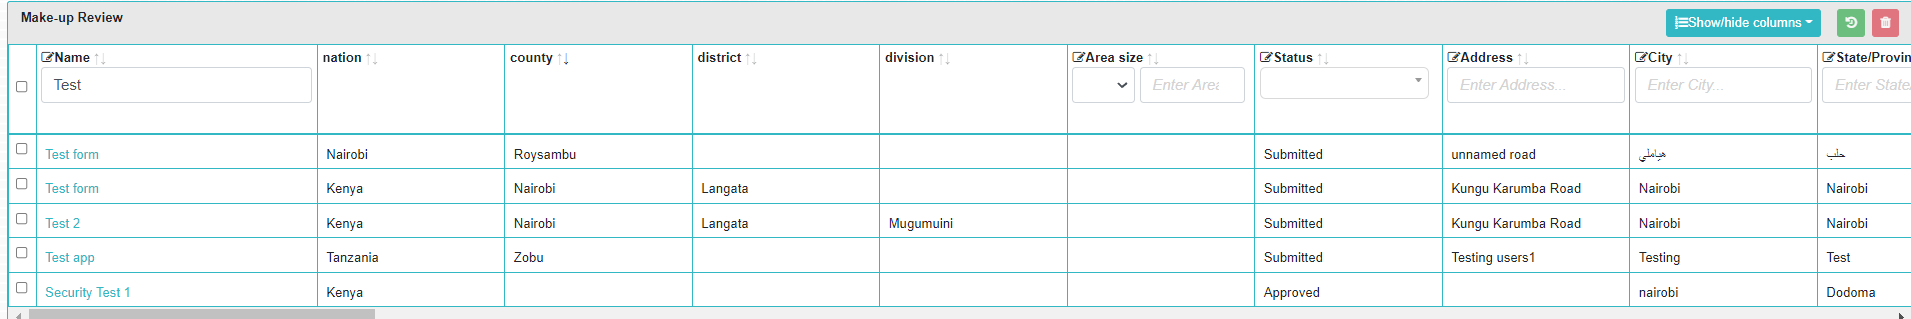
Figure 8: Filter data
Text, numeric, select and date fields can also be edited in table view by double clicking a cell in the column. Editable fields are marked with the icon  on each column header.
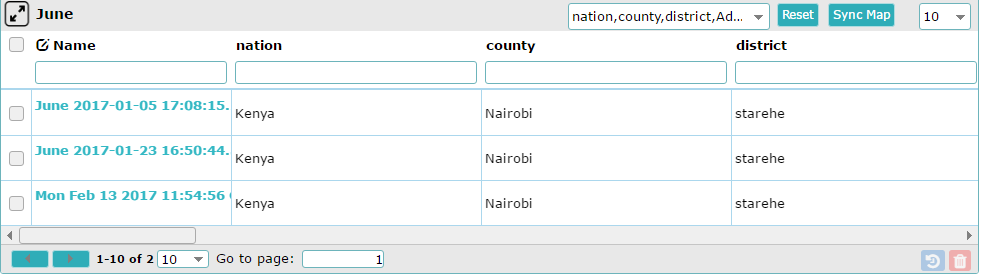
Figure 9: Table view of data
To view detailed data of a data point, click on the unique identifier under the ‘Name’ column on the table. Upon clicking on the data point identifier, the data associated with that data point will be displayed.
Task view
Task view is a feature that allows users to view all the main form and subform tasks belonging to their group’s currently active form list and the responses for each default task question. Only tasks with status are displayed. To access the task view, click on the tasks button. If the form filter had been used on the main data viewer filter, only subform tasks belonging to the forms selected will be displayed or the forms themselves if they were main task forms.
Filtering data
As shown in the previous section, data points can be filtered according to forms and locations. Additionally, data can be filtered according to the users that collected the data, date modified or both. To apply filters to collected data on the Data viewer, follow these instructions:
(i)Filtering by Users
To filter data by users who collected the data: a) Ensure that you have selected the form as described in previous sections. b) Select the check boxes alongside the users whose data you wish to view.
(ii)Filtering by date
To filter data points according to date modified:
Select the From date from the date picker.
Select the To date from the date picker.
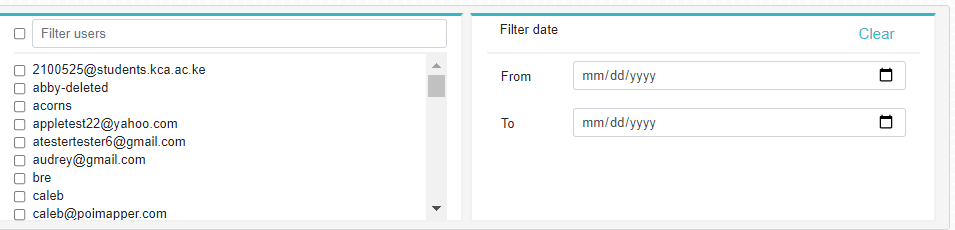
Figure 10: Date and User Filter
(iii)Filtering by both user and date
To filter data points by both user and date, select the users you would like to view and the date span of when the data points were modified.
The filtered data points will be displayed on the selected view.
Shared Data
Here, data points shared to users via Share or Transmit (Transmit is a reference table feature discussed later) are shown. The main use of this table is to show data shared to users that have not been registered to your organization’s Poimapper account prior to sharing. These users are restricted to see only the shared data. This feature is enabled by checking the checkbox Allow ordinary users to share data with unregistered users checkbox in the user Admin Tool.
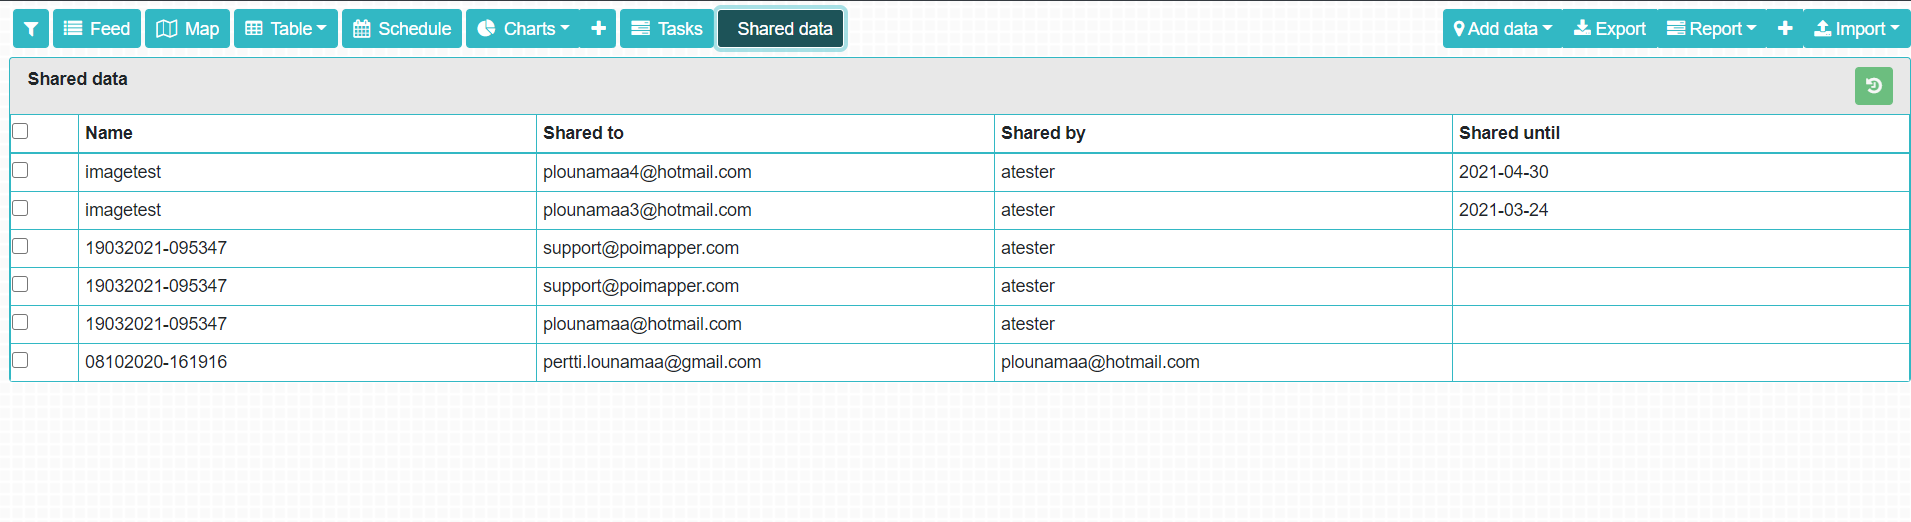
Figure 11: Shared Data Feature
Adding a new data point
There are two ways of adding a new data point
Clicking on the Add Data button.
Placing a marker on the map view
To add a data point in the Data Viewer, follow these instructions:
Click on the Add Data button on the top right of the Data Viewer window and a drop down will appear containing all form names.
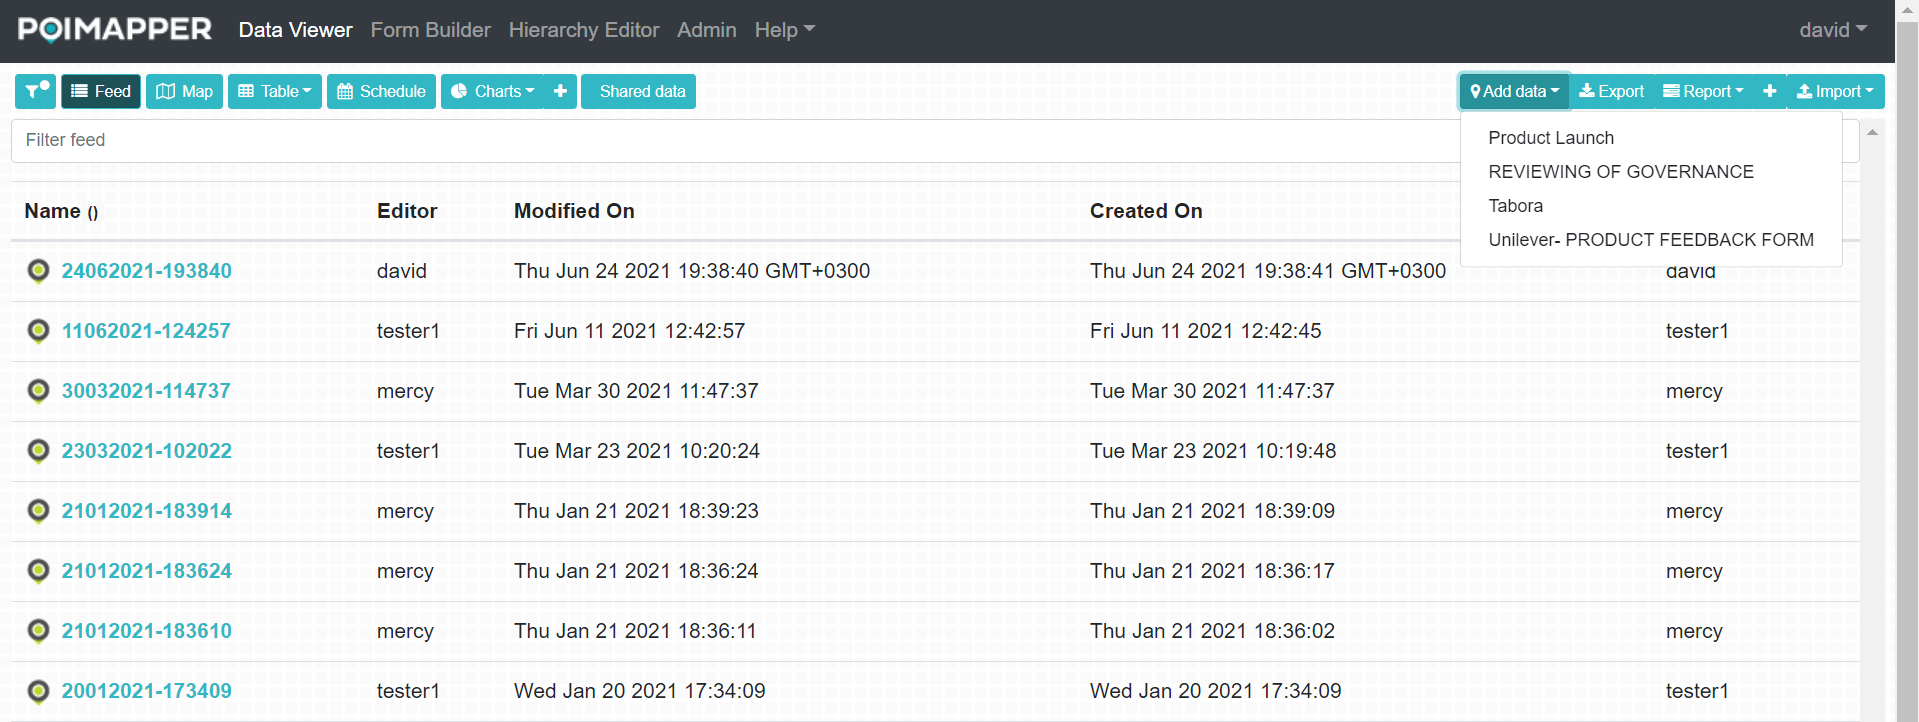
Figure 12: Add a new data point
Select the form you would like to add data to and a window will appear showing an empty instance of the selected form.
Alternatively, you can add a data point by dragging the marker icon to the map on the Data Viewer window as per the preferred location. A pop up will be displayed with all the forms on the active form list that have “include coordinates” enabled allowing you to select the form based on which you would like to add the data point. After selecting the form, it will be displayed with the coordinates of where you dropped the mark marker filled in and the rest of the other fields will be empty, allowing you to input the data.
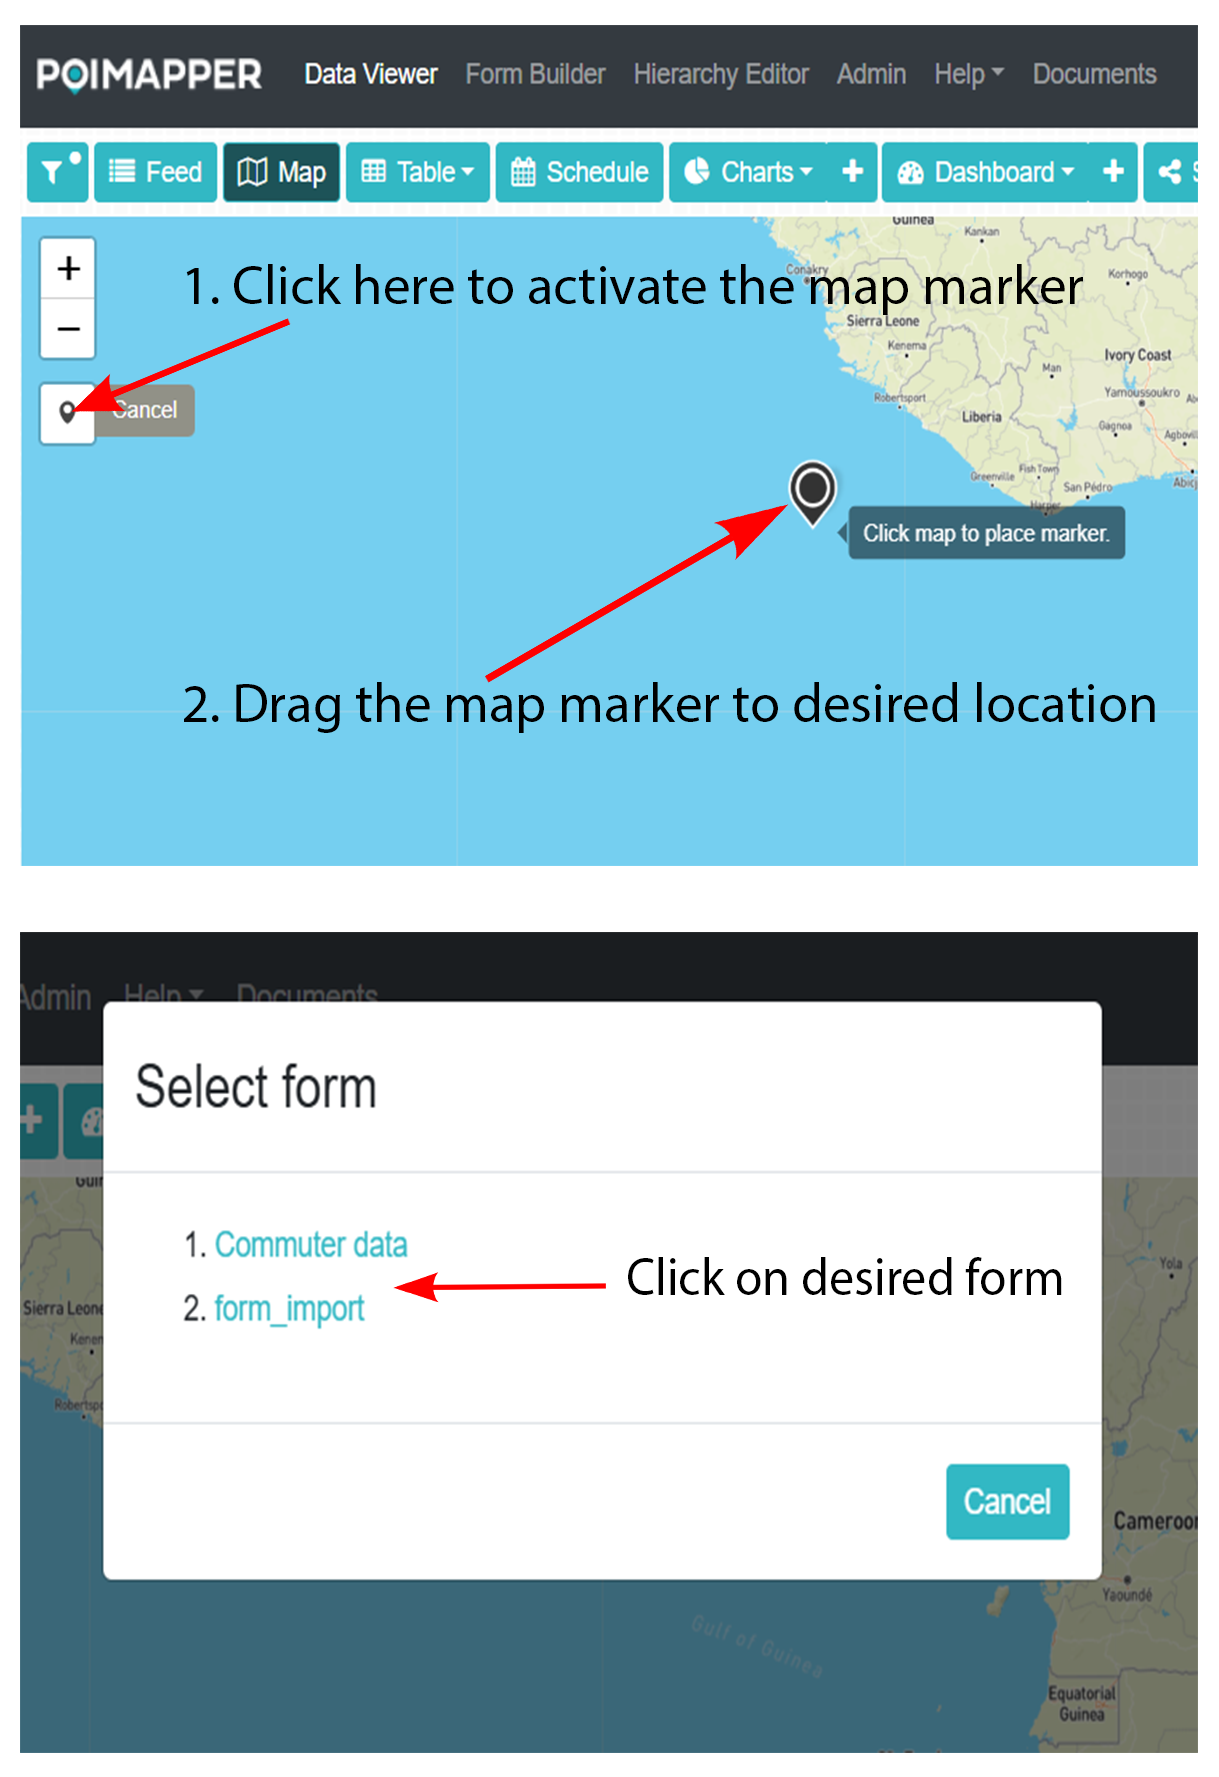
Figure 13: Alternative way of adding a data point
Scheduling
To access the schedule window, click on the Schedule button. All the forms with “scheduled status” enabled are displayed on the select form drop down. The schedule option enables you to assign data points of a form to a user on specific dates. This will notify the assigned user to update the data points on specific days and the data points will appear on their “My Schedule” view.
To schedule user to existing data points do this:
Select the form in the select form drop down, all its data points will be displayed below.
Navigate to the calendar for the month and year you want to schedule for by clicking on the forward and back buttons.
Click on a desired data point listed below the selected form and drag drop it on the desired calendar date
Select the user you want to schedule the data point for
To schedule user to new data points do this:
Select the form in the select form drop down
Click on a desired scheduled date, a pop up window will appear which will either be empty or has data points scheduled on that day.
Click add and select select a user
A single instance view of the form will be opened.
Click save to schedule the new data point for the user.
The figure below shows the data points that have been assigned to specific dates
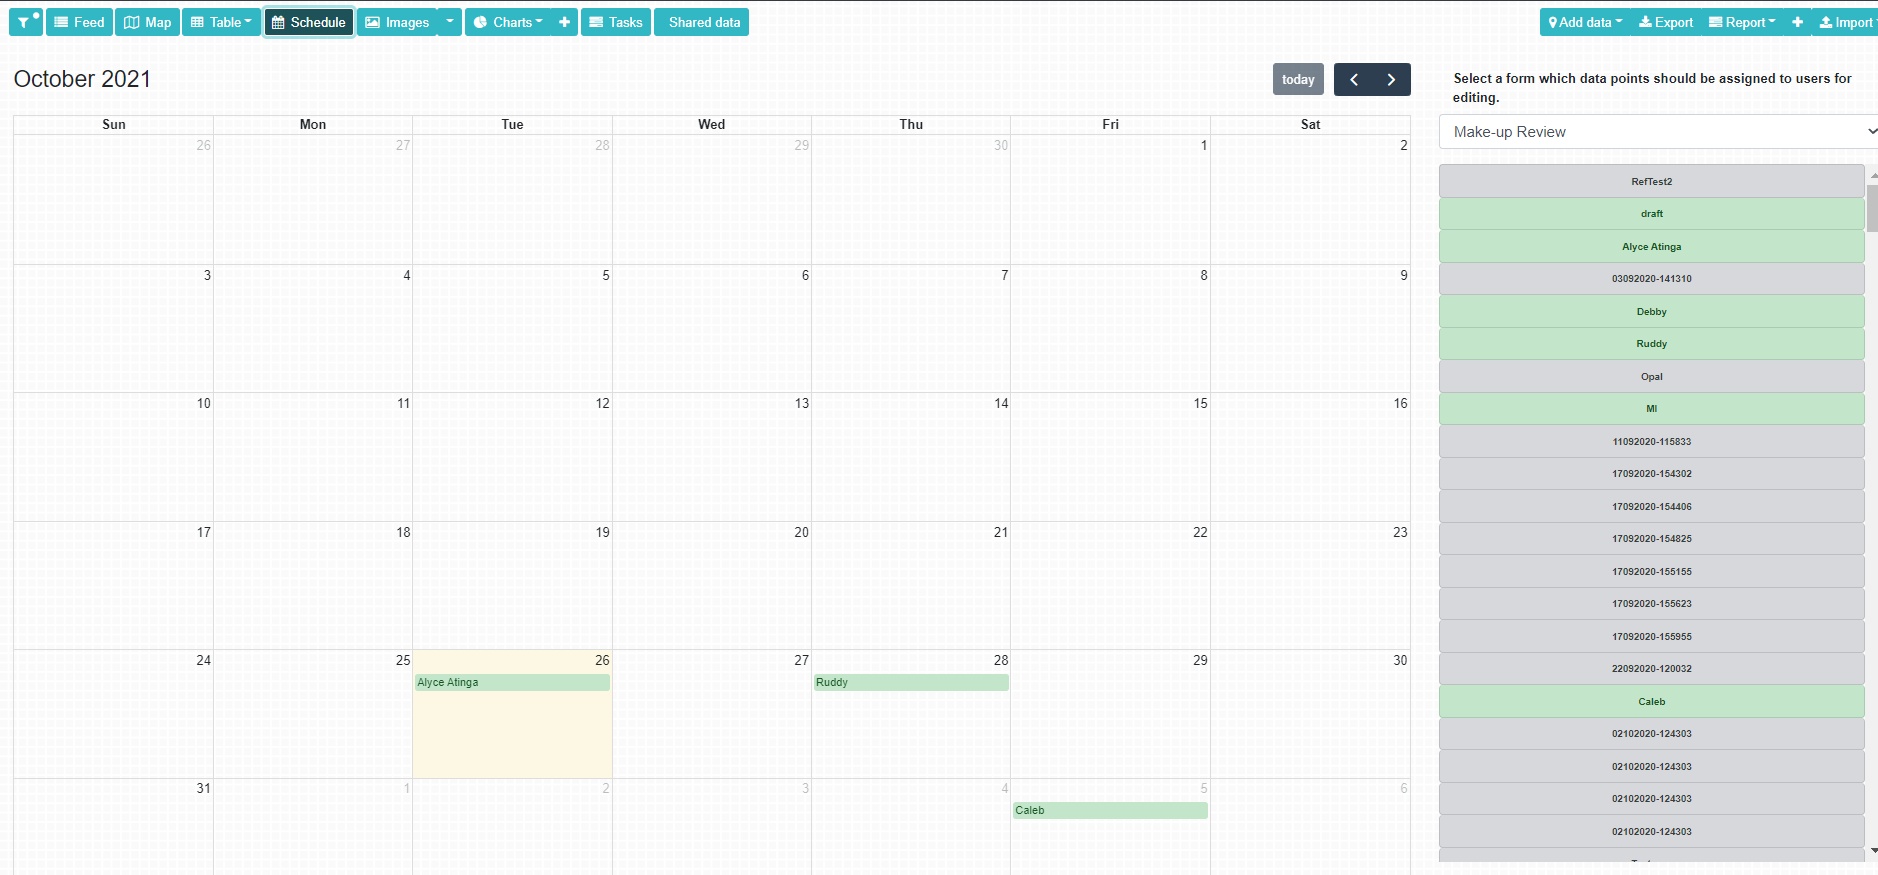
Figure 14: Scheduling
My schedule
My schedule displays the data points that have been scheduled for you. The data points are scheduled from the Schedule tab.
On clicking the My Schedule tab, If there are data points that have been scheduled for you, you will see the name of the data point, Schedule date, and schedule status.
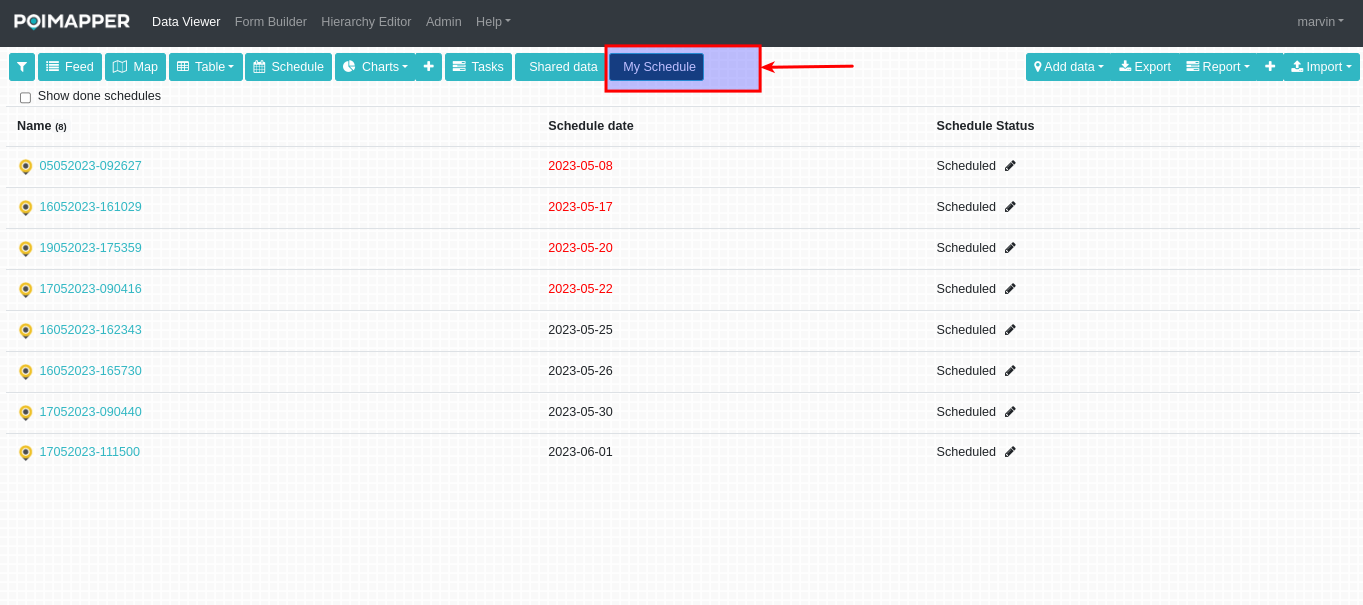
Figure 15: Click My schedule
1. Name
This is the identity of a data point. Each name is unique and will help you identify between the different data points.
2. Scheduled date
The date shown here refers to the set date upon which you should act upon the data point that has been scheduled for you. Data points are arranged according to the scheduled date in chronological order.
3. Scheduled Status
A data point that has been scheduled for you will have a status of Scheduled. Once you start working on the data point, you can manually change the status to Ongoing and to Done once you are done working on the data point.
How to change the scheduled status
Click on the edit icon next to the status.
Once a dropdown text box is shown, click on it and select a status you wish to switch to.
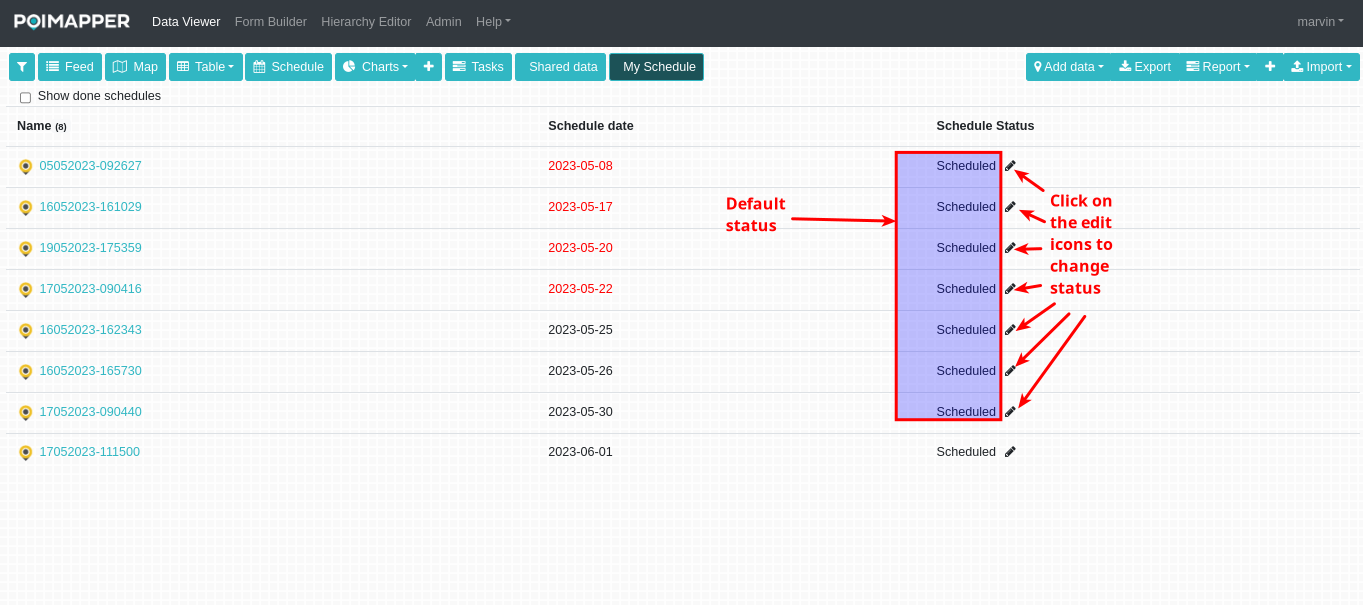
Figure 16: Schedule default status
After successfully changing the scheduled status, you will see a popup with “Schedule updated” message.
4. Schedule date colors
With scheduled status set as “Scheduled”
The default color of the scheduled date will be black. Once the date has passed, the scheduled date color will turn to red.
With scheduled status set as “Ongoing”
Once you start working on a data point and switch the status to Ongoing, the scheduled date color will turn to green.
5. Show done schedules
Those data points whose status is done are not displayed by default and can be made visible by checking the checkbox at the top.
Form Builder, Hierarchy Editor, Admin, and Help links
To access the Form Builder, Hierarchy Editor, Admin Tool,and Help links, navigate to the top menu and select the desired application as shown in figure 15 below:
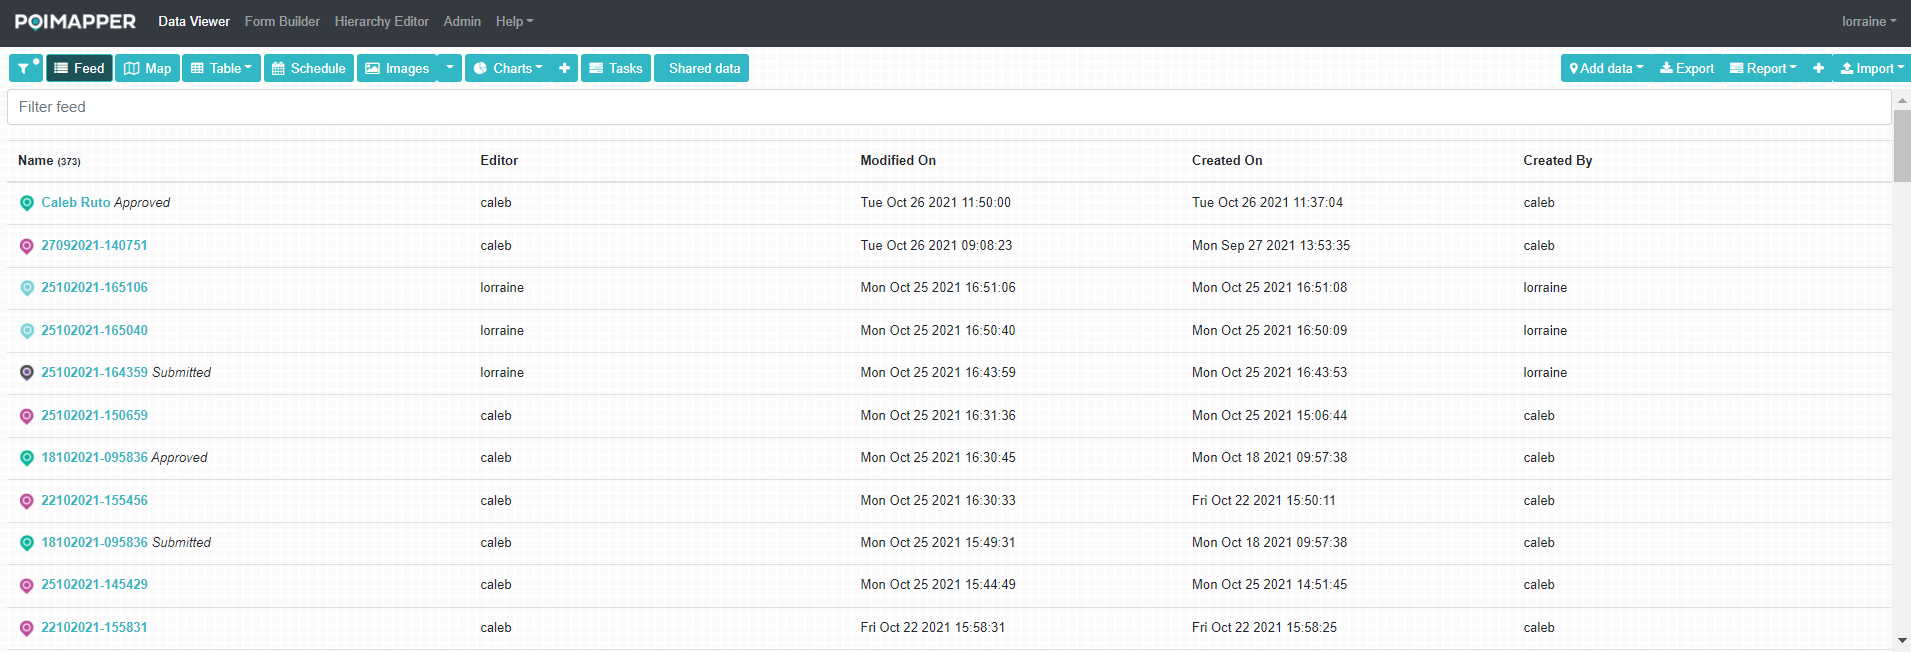
Figure 17: Form Builder, Hierarchy Editor, Admin, and Help links
The Form Builder allows a user to create forms and add them to a form list thus permitting you to add data in the Data Viewer window. More information about the Form Builder is available in the Form Builder and Hierarchy Editor manual.
The Hierarchy Editor allows a user to create a location hierarchy up to four levels. The four levels may correspond to the administrative hierarchy of an area or for example client organizations and sites. More information about the Hierarchy Editor is available in the Form Builder and Hierarchy Editor manual.
The Admin tool is used to perform administrative tasks in the Poimapper application. More information about the Admin Tool is available in the Admin tool manual. To access the Admin Tool manual, navigate to the Admin window then click on the Help link.
The ‘Help’ link provides access to the tutorial videos, user manuals and release notes.
Settings
Navigate to the drop down menu under the username on the top right corner of the window. The following options are displayed:
Data retrieval URLs: This displays Data Retrieval URLs table.
Manage maps: This displays a window that allows users to manage their custom maps.
Transcription language: Allows you to help the system identify the transcription language while generating transcriptions in text fields with audio transcription enabled.
Use two-factor authentication: This allows you to set up two factor authentication for your account.
Remember my filter selections: If selected, this saves your filter selections on data viewer.
Use clustering in map: If selected, data points on the map which are overlapping are not separated, but a cluster icon will be shown instead. The number of overlapping data points will be displayed on the cluster icon. Note that the number of overlapping data points depends on the zoom level of the map.
Change password: This enables the user to change their passwords.
Email Notification: Allows you to choose when you want to receive email notifications, and the options are: Receive email notifications when new data is created, when data is updated and when data created by me is updated.
Portal Language: Poimapper allows you to select the language you want the portal website to be displayed in by selecting the language on the drop down menu. The languages available are English, Spanish, French, German, Swedish, Italian and Finnish.
Select form Language: If you have defined forms with active langauge views on the current form list, they will all be available as options on this drop down in addition to the original form language. You can select the desired language and the form with that view will be displayed in the selected language. Additionally, if the portal language selected matches an option on select form language, the system will automatically select the matching language as the form langauge.
Logout: User can log out using this option on the menu.
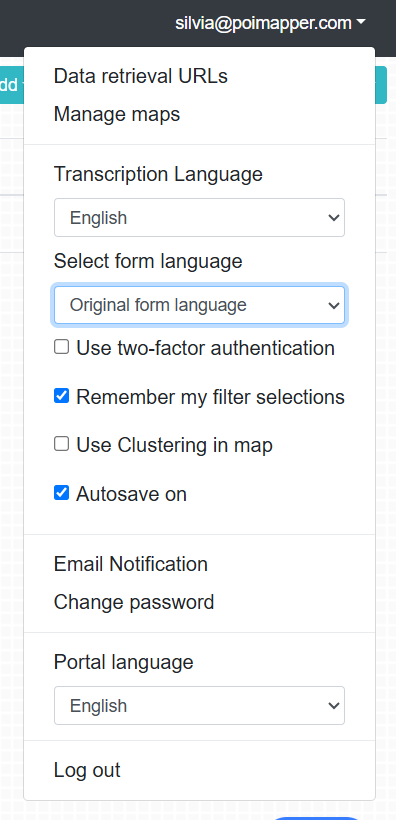
Figure 18: Settings