Dashboard
Introduction
The dashboard feature serves as a centralized location, bringing together data that has been analyzed using the various types of charts into a single view. By providing a clear and concise view of important data, the dashboard feature supports decision-making processes.
Creating a dashboard
To create a new dashboard, click on the + sign next to the dashboard tab.
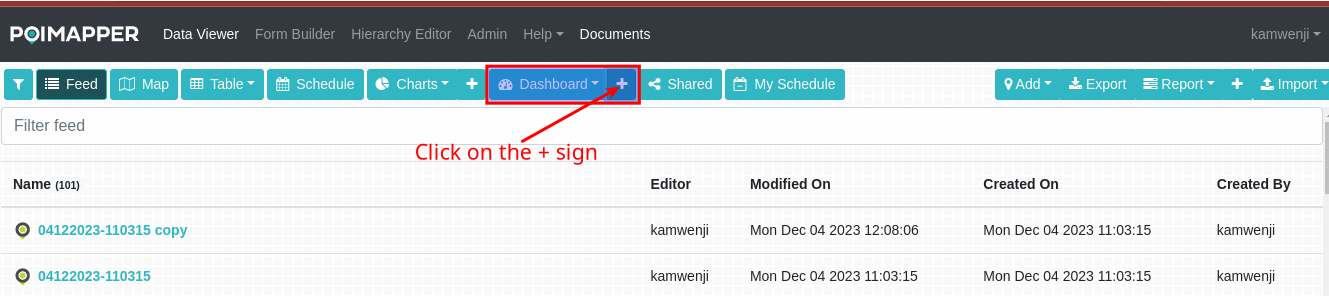
Figure 1.1: Adding dashboard option
A pop up will be displayed. Enter a name suitable for the dashboard you are creating and click on the save button.
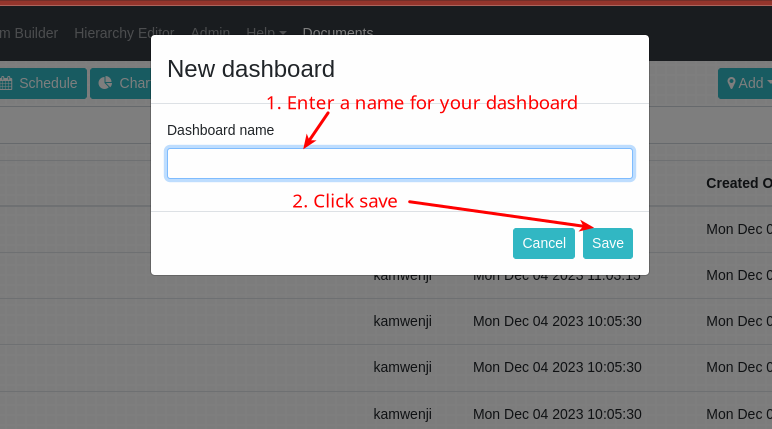
Figure 1.2: Creating dashboard popup
Once the dashboard is created, you can view the list of all created dashboards by clicking on the dropdown icon next to the Dashboard tab.
Adding charts to the dashboard
To add charts to the dashboard, follow the steps below
Click on the dropdown icon next to the Dashboard tab. A list of all created dashboards will be displayed.
From the displayed list, select a dashboard you want to add charts to. You will now have a page like the one shown in the image below.
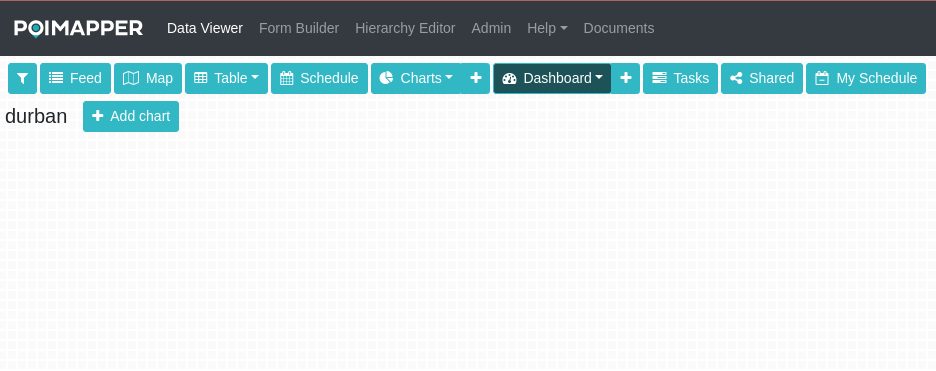
Figure 1.3: Adding chart to dashboard
Click on the Add chart button and a popup window will be displayed
Select a chart from the dropdown list. If your list is empty, make sure to go back to the charts tab, generate a chart and save the chart report for the chart to appear here. In the case that you have charts already generated, make sure that the chart report only contains a single chart in it.
Click on the Add button
Adding data points to a dashboard
To add data points to a dashboard follow the steps below: 1. Click Add data point button
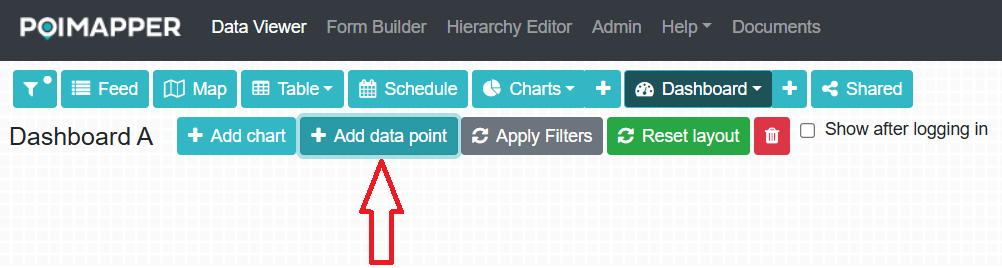
Figure: Adding data point button
An Add data point pop up will be displayed, select the desired form from the drop down
A list of data points belonging to the selected form will be shown and will be filtered according to the currently set data viewer filters
Select the data points you want added to the dashboard
Click add to add the data points or cancel to exit the pop up without adding any data points
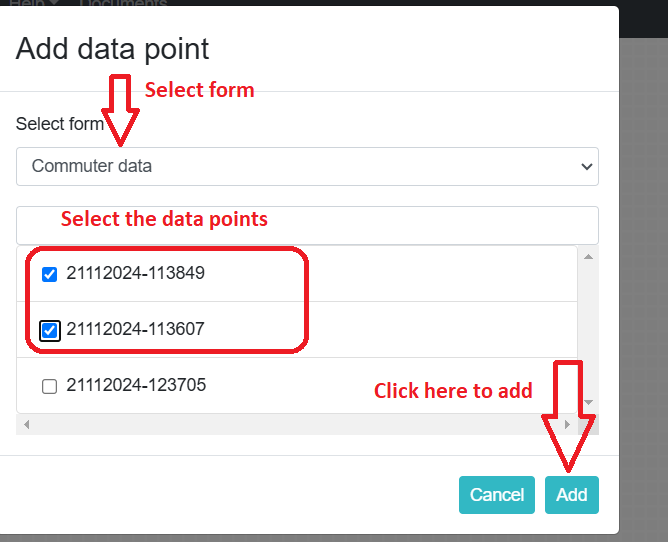
Figure: Adding data point pop up
All the data points selected will be displayed on the dashboard. If you want to delete any of them, click the delete button on the top right of the data points window, then confirm its deletion by clicking remove on the confirmation pop up.
The added charts/data points will be arranged in two columns, and users can rearrange them by dragging the charts to their preffered positions.
Viewing dashboard on login
A user can choose to display a specific dashboard to their group’s users when they log in. To enable this, the user must check the Show after logging in setting in the dashboard actions menu. Only one dashboard can be set to display on login at a time. If the user selects ‘Show after login’ on a different dashboard, it will automatically deselect the setting from the previously chosen dashboard.
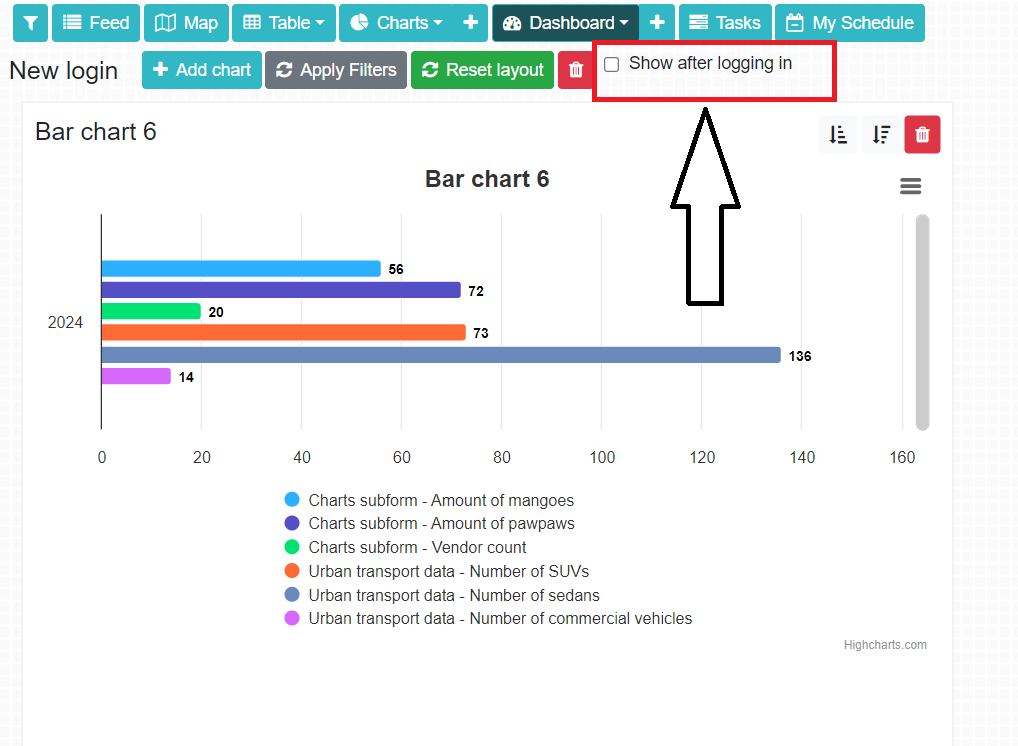
Figure 1.4: Show after logging in